Assignment 1
Exploring Combinations of Linear Functions
Make up linear functions f(x) and g(x). Explore with different pairs of f(x) and g(x) the graphs for:
i. h(x) = f(x) + g(x)
ii. h(x) = f(x) * g(x)
iii. h(x) = f(x)/g(x)
iv. h(x) = f(g(x))
First, I chose a pair of linear functions.
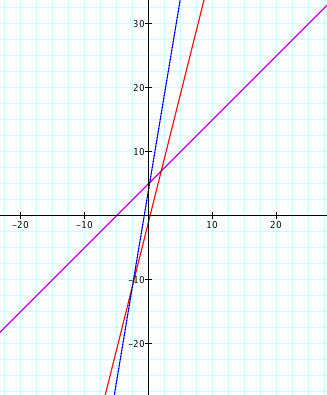
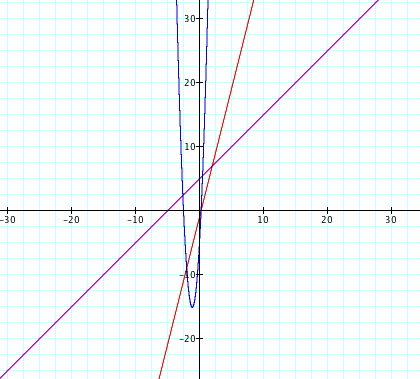
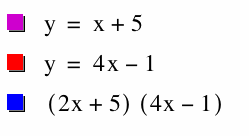
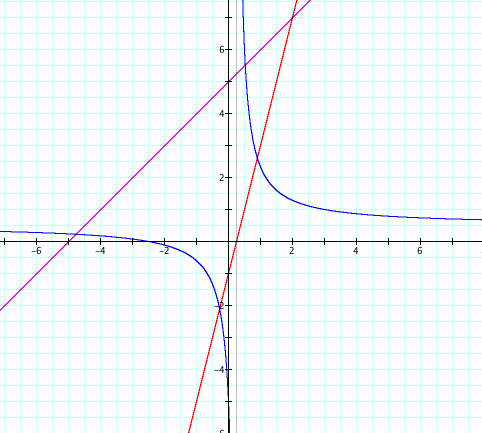
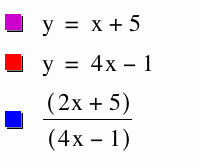
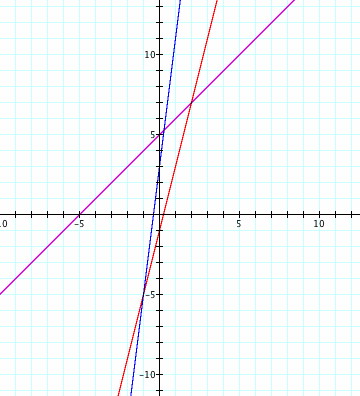
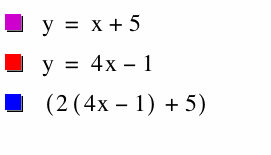
Let f(x) = x + 5 and g(x) = 4x - 1. [Note: In the graphs below, f(x) is represented by the purple line, g(x) is represented by the red line, and the blue function represents the graph h(x).]
Let's examine the graph of f(x) + g(x). When adding 2 linear functions, we obtain a third linear function. If we think about this algebraically, we would simply add like terms which would result in another polynomial of degree 1.
Next, let us explore the multiplication of two linear functions. If we multiply 2 polynomials of degree 1, we will have a term that is of degree 2. Therefore, as you can see in the graph below, we have our original 2 lines, f(x) and g(x), and also the graph of a parabola. In both functions in our pair we have a positive slope. When these 2 x terms are multiplied, we will have a positive x squared term which tells us that our resulting parabola will open upwards.
This combination on our function pair gets a little more interesting. As you can see, the resulting fuction h(x) is a hyperbola. This is the exact definition of what a hyperbola is, it is a function in the form h(x) = p(x)/q(x) such that p(x) and q(x) are polynomials. In this case p(x) and q(x) are both linear and are represented by f(x) and g(x) respectively. It is also important to note the important parts of our hyperbola. We have a vertical asymptote and x = 1/4, an x-intercept at ( -5/2, 0), and a y-intercept at (0, -5).
Initially, the composition of these linear functions seems like it will result in the most interesting looking graph but we must think about algebraically what is happening here. In the composition of f and g, we are simply substituting g(x) into the x of f(x). Therefore, the highest degree term is still 1. We are not multiplying or dividing and x terms here. Thus, the graph of h(x) is also linear.
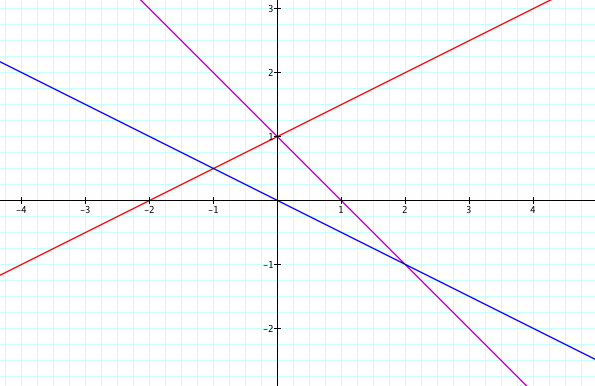
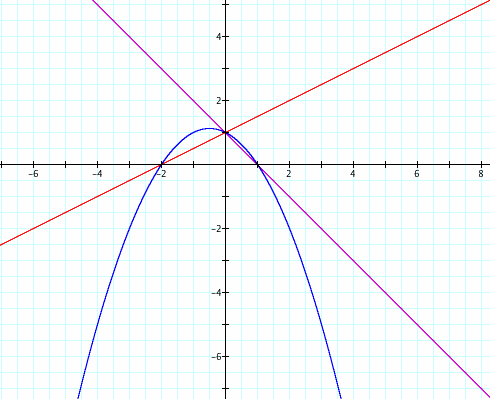
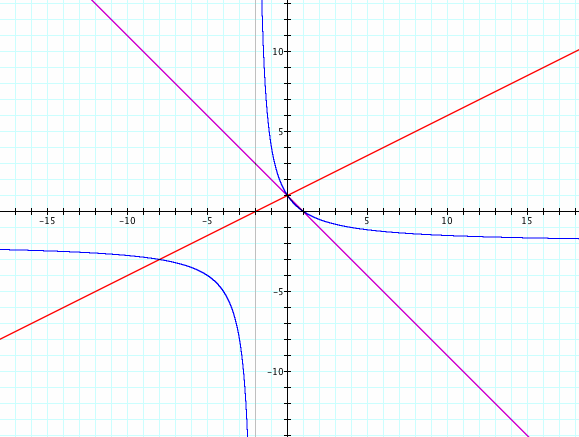
Let's look at a second example.
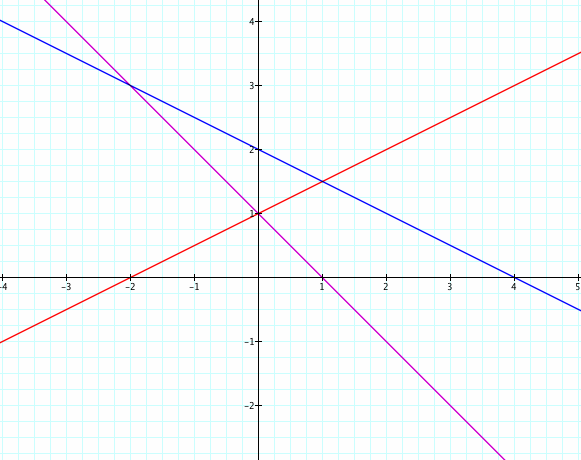
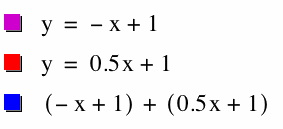
Let f(x) = -x + 1 and g(x) = x + 4.
Now, we have one line that has a positive slope and one line that has a negative slope. When we add the 2 functions, we obtain a 3rd line for h(x). In this case, h(x) also has a negative slope although this is not always the result. We could have a pair of functions, one positive sloped and one negative sloped, that results in a positive sloped h(x).
It is interesting here to compare the multiplication of this pair of functions to the multiplication of our first 2 functions. As expected, h(x) is a parabola. However, this time the parabola opens downward. This is because the terms that produce our x-squared term are -x and .5x, one is positive and one is negative. Since the sign of our squared term is negative, we have a parabola opening downward.
The graph of h(x) here looks very similar to the one in our first pair however there are some differences. It is also a hyperbola, as expected, but our critical points have changed. We can see that we have a vertical asymptote at x = -2, an x-intercept at (1, 0), and a y-intercept at (0, 1).
This composition of f and g is also interesting to examine. Here, we are substituting g(x) into the x term of f(x). If we think about this as a series of transformations, we can see that our original g(x) line is being made negative. In other words, our red line is flipping over the y-axis. The second transformation made is a shift downward by 1. When we analyze the composition of f and g in this way, it should provide another way of justifying why h(x) is a linear function.